| Look
Park - Weekend Events |
Robert
Leverett |
| Feb
06, 2006 07:45 PST |
ENTS,
LOOK PARK-CROWN DISPLACEMENT MEASUREMENTS:
On Saturday and Sunday, I went to
Look Park in Northampton
(technically Florence) to begin measuring the horizontal offsets
from
the trunk of the high points of a sample of trees. In each case,
the
high point was first located and then I lined myself up so that
my eye,
the high point, and the trunk were in a straight line. The
horizontal,
eye-level distances to the high points and the trunks were
measured and
the absolute value of the differences taken. The following table
gives
the results. As can be seen, for the sample of 12 trees, the
average
offset is 9 feet. This compares favorably with a large 1800-tree
sample
I ran from my database many months ago. I think that result
yielded an
average of 8.2 or 8.3 feet.
Many more trees will have to be
modeled before we can present
tables of average offsets for various species and form classes
of trees.
However, we know what the across species averages are very well.
As
proof of that, on Monday, I received a super spreadsheet from
Will
Blozan summarizing work done by I presume the Will-Jess team on
crown-point displacement. The spreadsheet includes data on 100
trees of
10 species. The average of the absolute values of the crown
displacements is 8.2 feet!! In terms of knowing the average
offset, I
think we are there. Great job Will and Jess. In computing the
average
offset, absolute values needed to be averaged so that trees that
lean
away from the observer averaged with tree that lean toward the
observer
don’t cancel each other out when using data gathered from
height
measurements.
Species Hgt Cir Hz-Offset Avg
SY 92.5 9.8 22.5
SY 96 8.5 11.4
SY 96.9 9.2 6.9
SY 99.8 6.8 9
SY 104.3 10.7 7.5
SY 113.1 8.2 9.9
SY 114.3 16.4 11.4
SY 116.6 10 3.3
SY 119.1 12.2 5.7 9.7
--------------------------------------------
WP 121.3 6.6 6
WP 125.8 9.5 6.6
WP 131 9 7.8 6.8
---------------------------------------------
Average 9.0
LOOK PARK RUCKER INDEX:
On Sunday, I finally completed a Rucker Index
for Look Park. It is as
follows:
Height Species
Circumference
136.0 White Pine 9.6
119.1 Sycamore 12.2
112.1 Shagbark Hic 5.2
110.2 N. Red Oak 10.4
106.3 Red maple 6.5
105.4 Sugar Maple 10.5
101.5 American Elm 8.0
93.1 Black Locust 5.9
92.8 Hemlock 7.5
89.1 White Oak 7.3
Rucker Index
106.55
Look Park got hammered in the 1938
hurricane. The park lost 257
trees. Many of the larger, older pines have had their tops blown
out.
The loss of crowns is highly visible in the forms of these pines
today.
Their recovery is bears testament to the capacity of white pines
to
continue life after losing their tops. I do believe that in time
Look
Park will produce a few 140-foot pines, though 136 is the
tallest now.
Besides the pines, Look Park has a
number of gorgeous, large red
oaks. A sample follows.
Circumference Height
11.1 100.8
10.9 104.4
10.4 110.2
9.3 103.3
WHITE PINES OVER 130 FT IN THE CONNECTICUT RIVER VALLEY
So far, in the Northampton area, I’ve
measured 6 white pines to over
130 feet. Look Park has 4 over 130 that I’ve measured. There
is one on
Smith College Campus, and Monica’s Pine. There are bound to be
others
lurking around. There are no less than a dozen in Mount Tom
State
Reservation over 130 and probably a dozen and a half. There are
couple
or three in a ravine in Easthampton. However, within the
Connecticut
River Valley, so far there has been only one solidly confirmed
white
pine that reaches 140 feet. One of the Easthampton pines may
make it,
but I get conflicting measurements.
THE MACROSCOPE
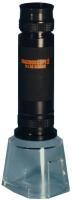 MACROSCOPE 25 is a fixed magnification unit that provides 25X
magnification over a field of view measuring approximately
8mm(5/16"). It incorporates a double calibrated
interchangeable measuring reticle providing precise measurements
in both English and Metric systems. By detaching the base and
close-up lens MACROSCOPE 25 can be used for 8x distance viewing,
and with formulas included, make distance or height
approximations.
MACROSCOPE 25 is a fixed magnification unit that provides 25X
magnification over a field of view measuring approximately
8mm(5/16"). It incorporates a double calibrated
interchangeable measuring reticle providing precise measurements
in both English and Metric systems. By detaching the base and
close-up lens MACROSCOPE 25 can be used for 8x distance viewing,
and with formulas included, make distance or height
approximations.
My Macroscope 25 came on Friday. Like Will and Jess say, it is
one
sweet instrument. Here are the results of the first simple test.
Dist Mills Diam Diam D-Tape
Diff RD 1000 Diff
Mtrs Mtrs Inches Inches
Inches Inches Inch
21.9 2.825 0.8249 32.47598 32.2 0.28 33.2 1.00
21.9 2.8 0.8176 32.18858 32.2 0.01 32.3 0.10
21.9 2.775 0.8103 31.90119 32.2 0.30 31.4 0.80
Average
0.20 0.63
Pct of act 0.6% 2.0%
As can be seen, the average
difference between three consecutive
readings and the D-Tape reading represents a percentage error of
0.6%
for the Macroscope 25 and 2% for the Dendrometer. I do realize
that the
D-Tape assumes circularity, so the above test is flawed from
that
perspective.
A big advantage that the
Macroscope 25 has over the RD 1000 is
that you can read the Macroscope 25 scale much easier and to a
far finer
resolution. Depending on how good your eyes are, you can read
the
reticle to 1 or 2 tenths of a millimeter. There is no question
about
reading it to the nearest quarter of a millimeter. In the above
table,
the middle row is the most probable reading for the Macroscope
25. For
the RD 1000, it is a toss up between rows one and two. Giving
the RD
1000 the benefit of the doubt, I chose to reflect the closer
reading to
the D-Tape reading as the best choice. The Macroscope 25 is an
astounding 0.01 inches off and the RD 1000 is an impressive 0.1
of an
inch off.
A lot more tests for the
Macroscope 25 are planned in consultation
with Will and Jess. They are light years ahead of me at this
point. But
right now, I couldn’t be more pleased. I have a great
combination. The
RD 1000 provides for quick modeling when extreme accuracy is not
required, and when it is, then to get ever finer, the Macroscope
25
comes roaring in. Sweet!
...
Robert T. Leverett
Cofounder, Eastern Native Tree Society
|
| Re:
Weekend Events |
Edward
Frank |
| Feb
06, 2006 12:56 PST |
Bob,
I have been thinking about your results from look Park. I am not
sure that
the results compare that well to your original analysis. I the
1800 tree
set you processed, the tops of the trees were oriented data
variety of
angles toward you away from you, angled to the left, angled to
the right of
the trunk. These variety of orientations produced an average
offset of 8.2
feet. In your experiment you lined up the top with the trunk on
the tree -
in effect maximizing the measured offset. Yet you only had an
offset of 9.0
feet, compared to that of 8.2 for the larger sample. I would
have expected
an offset greater than 8.2 by 30 to 60%. If truly random the
actual offset,
what you measured in your experiment, of the l800 tree larger
data set would
have been about 13 feet. Yet for your oriented sample set you
obtained an
average offset 9 feet. Even if there was some bias in the
original data
set, with more of the offsets toward you rather than randomly
distributed,
the result still would likely have been higher than you measured
9 feet.
Perhaps a larger sampling would yield different results, perhaps
this set of
trees just have less offset than did the larger set. Will and
Jess's
samples of 100 trees, if they did not specifically try to
line-up the top
with the trunk are consistent with the previous 1800 tree
analysis.
Ed
|
| RE:
Weekend Events |
Robert
Leverett |
| Feb
06, 2006 13:06 PST |
Ed,
You are right. I also would have
expected a greater average offset
based on the 13-foot derived average offset. From the
spreadsheet, Will
sent, it appears that Will's and Jess's data compare with my
1800
measurements. The 8.2 feet is established pretty well where
alignment
has not been attempted as a standard procedure.
Bob
|
| RE:
Weekend Events |
Robert
Leverett |
| Feb
07, 2006 07:20 PST |
Will,
I wasn't sure if Jess
participated. However, given your separate
test, it is good to have independent verification of the average
offset.
Just to reiterate for the membership at large, the 8.2 isn't an
indirect
mreasure of the difference between sine and tangent based height
determinations. Of greater impact on the difference is the spot
being
chosen as the crown point. Without a laser rangefinder, deciding
on what
spot in the crown is the high point to be measured and where
that point
is in relation to the base requires a very experienced eye. If
you don't
have it, the errors made on tall, broad-crowned trees can be in
the tens
of feet, as we've so often confirmed.
BTW, I ran another comparison test
of the macroscope and
dendrometer on a flat target that is exactly 18 inches wide. The
distance to the center of the flat target was 226 feet or 68.9
meters.
The angle to it was -9 degrees. The distance fed to the
dendrometer was
222.5 = (226-0.75)cos(-9), since the distance fed to the
dendrometer
must be the level distance to the vertical line containing the
target.
The dendrometer gave a width of 18.4 inches. The macroscope
yielded a
clear width of 5 millimeters on the reticle that convereted to
18.08
inches. The percent errors for the macroscope and dendrometer
were
respectively 0.54% and 2.22%. I was quite pleased with the
dendrometer
and absolutely ecstatic with the macroscope.
After a little more practice, with the
macroscope, plans to tackle
the Sunderland sycamore aren't far away.
Bob
| |
Will
Blozan wrote:
FYI- that list is solely mine...
|
|
|